Freely explore our free data marts for free
Try before you don't buy. Did we mention it’s free?
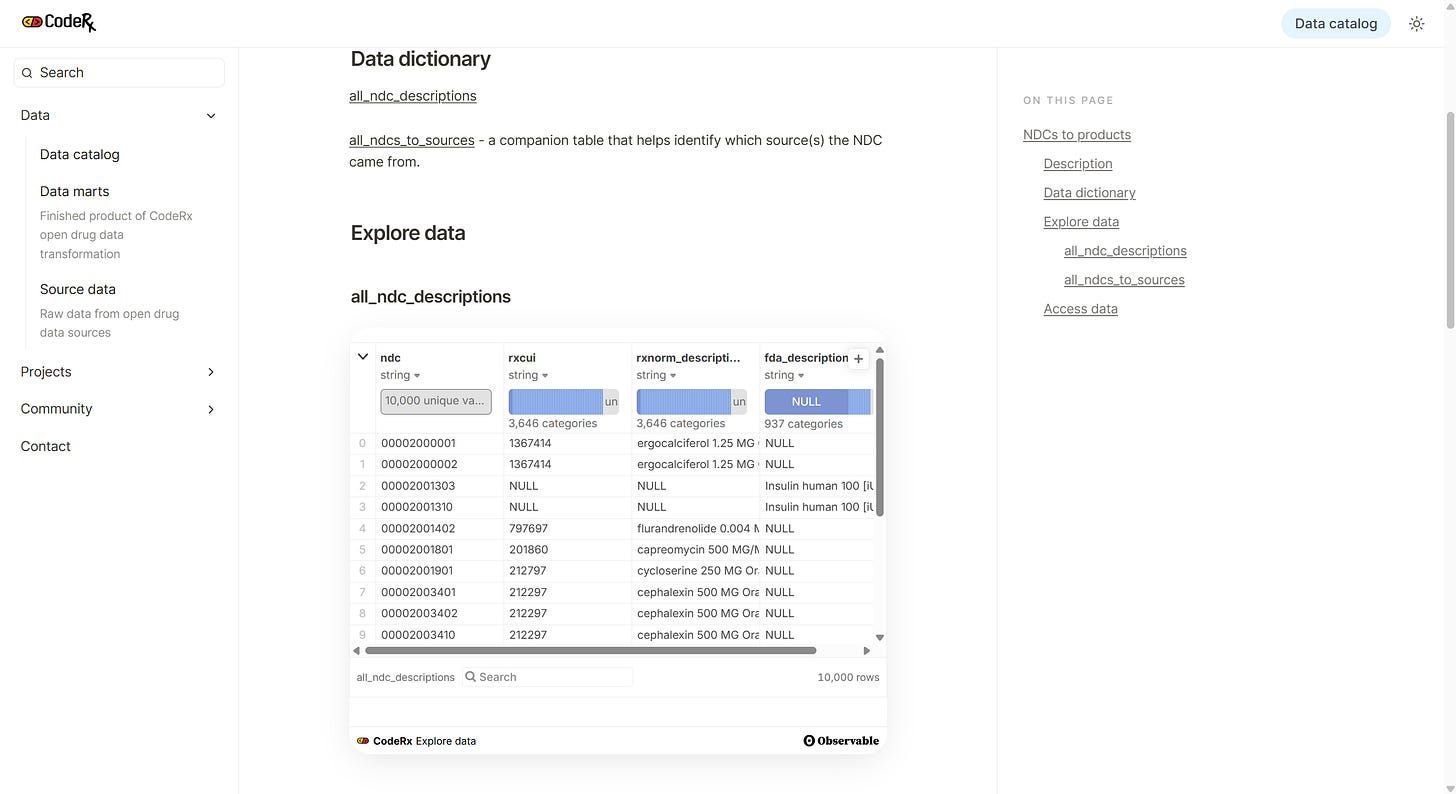
🔍 New on our website: Explore our data marts with an interactive table
We’ve just shipped a small but mighty update to our website that makes it easier than ever to understand what’s inside our data marts.
You can now browse the first 10,000 rows of every data mart through a slick new interactive table powered by Observable. No signup, no credentials, no SQL required — just click and explore. Whether you're a developer sizing up our schema or a data analyst trying to answer “Is this what I think it is?”, this feature gives you a quick, intuitive feel for how our data is structured and what it contains.
🔗 You’ll find the interactive tables linked right from each data mart page.
This is part of our broader mission to make drug data more accessible, interoperable, and inspectable. We believe good data tools should feel like good software: fast, transparent, and easy to test-drive.
Coming soon: Q2 2025 data mart updates
We're putting the final touches on our Q2 2025 refresh across all data marts — new data, new insights, and a few structural improvements. More on that soon.
Stay tuned 👀


